Screening for reducing substances using Benedict’s reagent

Abstract
Disorders of carbohydrate metabolism result in the accumulation of reducing substances. These are often present in the urine and stool of affected individuals and are not present in unaffected individuals. A screening test using Benedict’s reagent can be a quick and simple way to identify these substances. A colour change from blue to brick red is a positive result. Definitive testing can then be carried out.
Introduction
Reducing substances comprise all the sugars exhibiting ketonic. (2) A commonly used qualitative method for screening employs Benedict’s reagent. In this reaction, cupric ion (Cu 3+) is complexed to citrate in an alkaline solution. The reducing substances convert cupric (3+) to cuprous (2+) ions. This results in a colour change with the formation of yellow cuprous hydroxide or red cuprous oxide. (1) Sugars (e.g, glucose, galactose, fructose, maltose, lactose, and pentose) are characterized as reducing substances based on their ability to reduce cupric ions to cuprous ions. Reducing substances are often requested when carbohydrate malabsorption is suspected. (3)

Methods
Materials:
Controls: Positive and negative
Patient samples (urine and stool)
Benedict’s reagent
Equipment:
Heating block
Thermometers
Metal cap
Centrifuge
Vortex
Consumables
Control material
The positive control is made by dissolving 1g/50mL D-galactose into deionized water. Deionized water is used as a negative control.
Reagent
Benedict’s reagent was already pre-made for this experiment.
Method to prepare reagent is as follows: 17.3g CuSO4.5H20 in 100mL hot water. In a seperate container, 173g of Na3C6H507.2H20 and 100g Na2CO3 in 800mL deionised water, heat solution. Once cool, both solutions are mixed and diluted up to a otal volume of 1L.
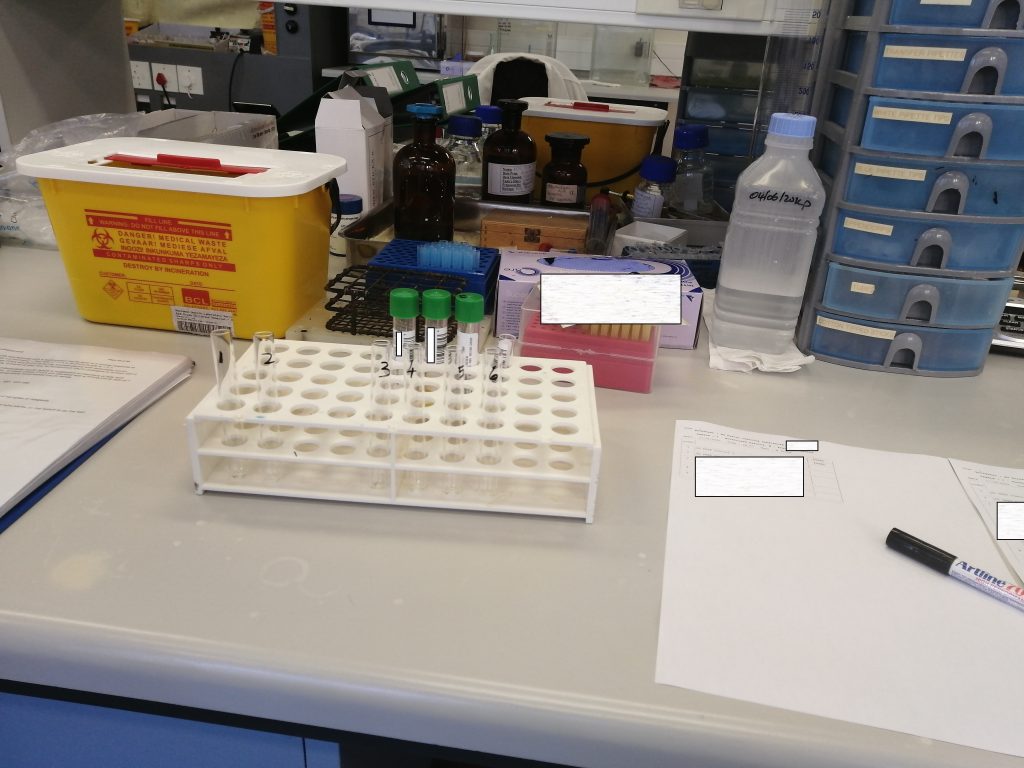
Sample preparation
Urine samples: Samples that were not clear were centrifuged at 4000rpm for 5 minutes.
Stool sample: only 1 stool sample was received and had a loose consistency. About 1.5mL of the sample was centrifuged at 4000rpm for 5 minutes.
2.mL of Benedict’s reagent was added to all of the test tubes. 5 drops of sample was added to each test tube. Tubes covered with a metal cap and vortexed. The samples were placed in a beaker of water at 100degrees Celsius for 3 minutes, while the water was still boiling. Samples were then vortexed again and allowed to sit for 10 minutes before reading.
-

Standard operating procedure used for this method -
Setting up -

2.5 mL Benedict’s reagent with no sample -
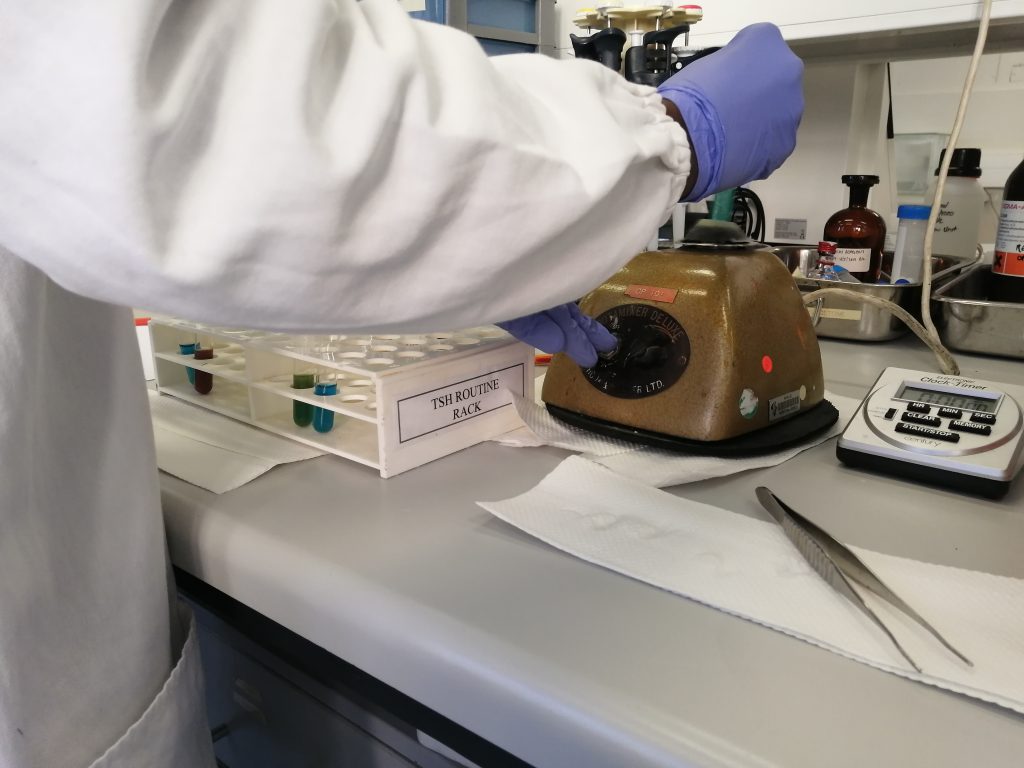
Samples vortexed after being added to the reagent. -

Incubate for 3 minutes in continuously boiling water at 100 degrees Celsius.
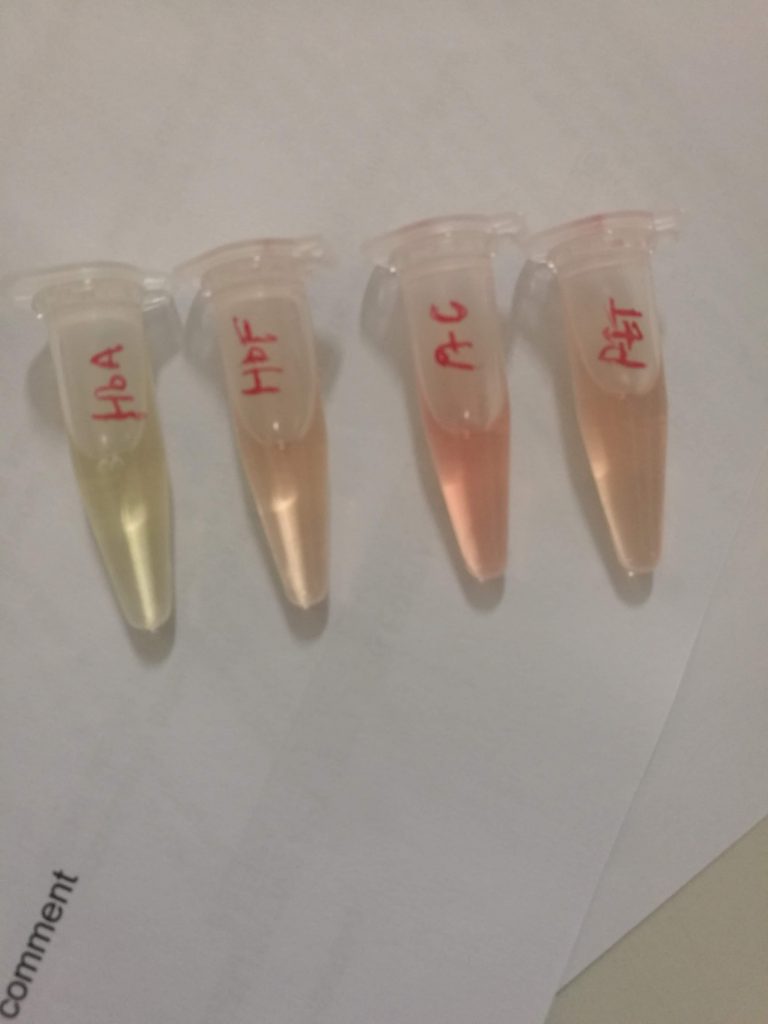
Tests that screen positive are then analyzed using more sensitive techniques. In our laboratory, this is with thin layer chromatography (TLC).
Results
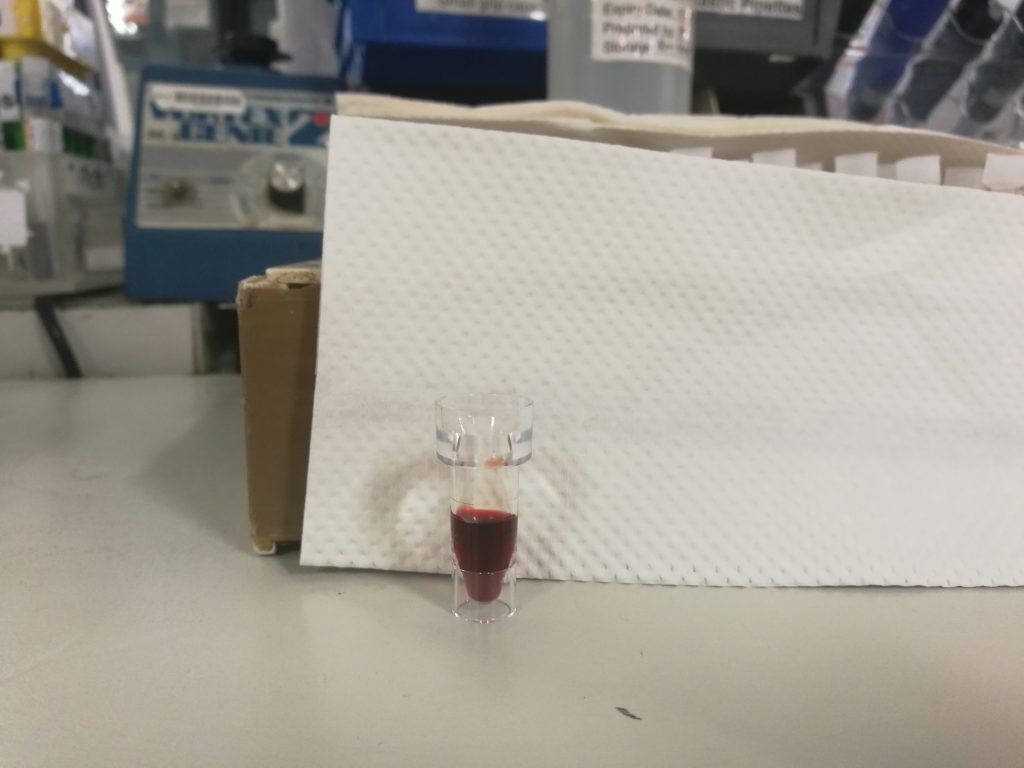
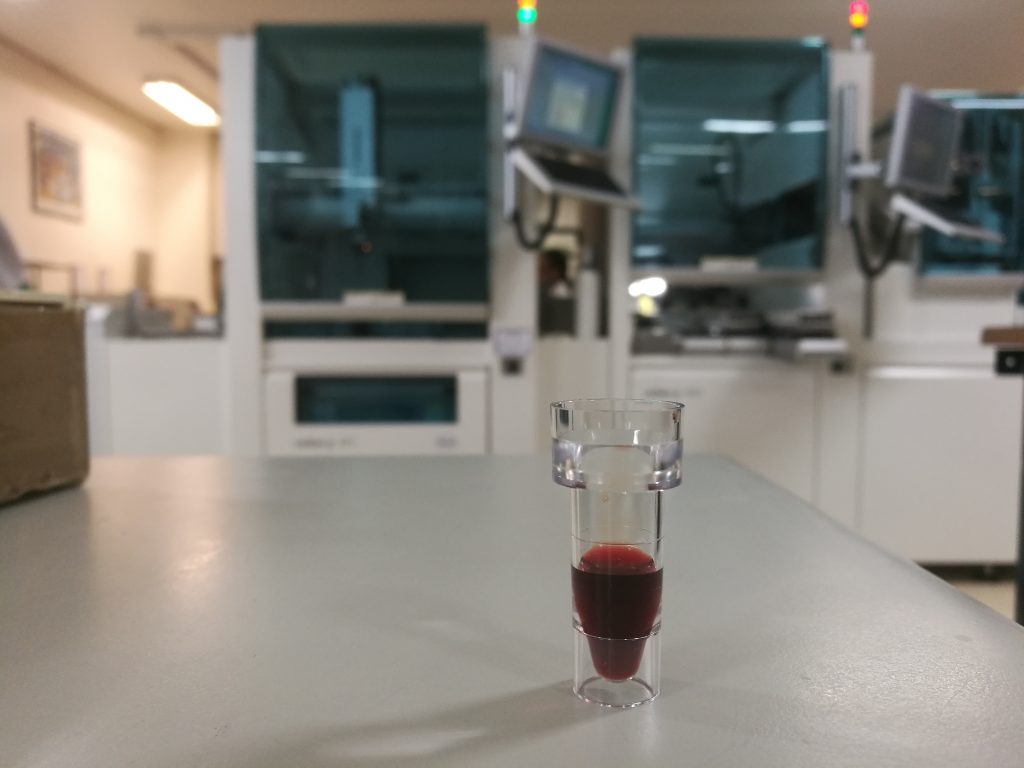
The control samples exhibited the colour changes that are to be anticipated. The negative control does not form cuprous ions (which are red) thus no colour change occurs. The galactose in the positive control acts as a reducing substance and converts cupric (3+) to cuprous (2+) ions (thus resulting in the brick-red colour). The patient samples exhibited a trace result with a mild change to a green colour, likely due to the formation of yellow cuprous hydroxide. The 1+ positive sample had yellow precipitate with sedimentation visible in the bottom and top layer of the solution.
-
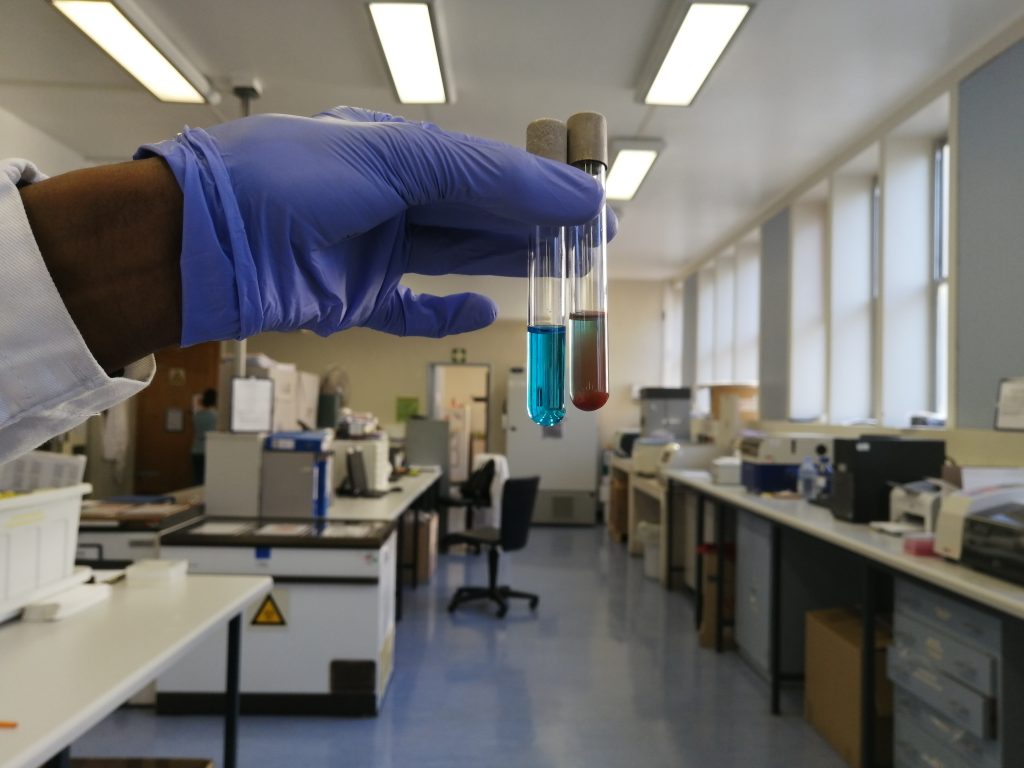
Negative control on left, positive control on right. -

Trace positive on left, negative control on right. -

Negative control on left, 1+ positive on right (note yellow precipitate)
Discussion
False-positive results may be produced by contamination of urine with H2O2 or a strong oxidizing agent, such as hypochlorite (bleach). Exposure of dipsticks to air gives false-positive readings after 7 days. False-negative results may occur with large quantities of reducing substances, such as ketones, ascorbic acid, and salicylates. Several antibiotics that contain ascorbic acid as a preservative may also produce false-positive results as it is excreted essentially unchanged.
Clinically, a negative test in the absence of a lactose containing diet cannot exclude galactosaemia.
Reducing substances other than glucose should be further identified by chromatographic procedures. The measurement of glucose has now been replaced with more-specific, convenient and inexpensive methods.
References
- Tietz Textbook of Clinical Chemistry,
- Compendium of International Methods of Analysis- OIV: Reducing Substances
- Faecal Reducing Substances. https://www.gloshospitals.nhs.uk/our-services/services-we-offer/pathology/tests-and-investigations/faecal-reducing-substances/